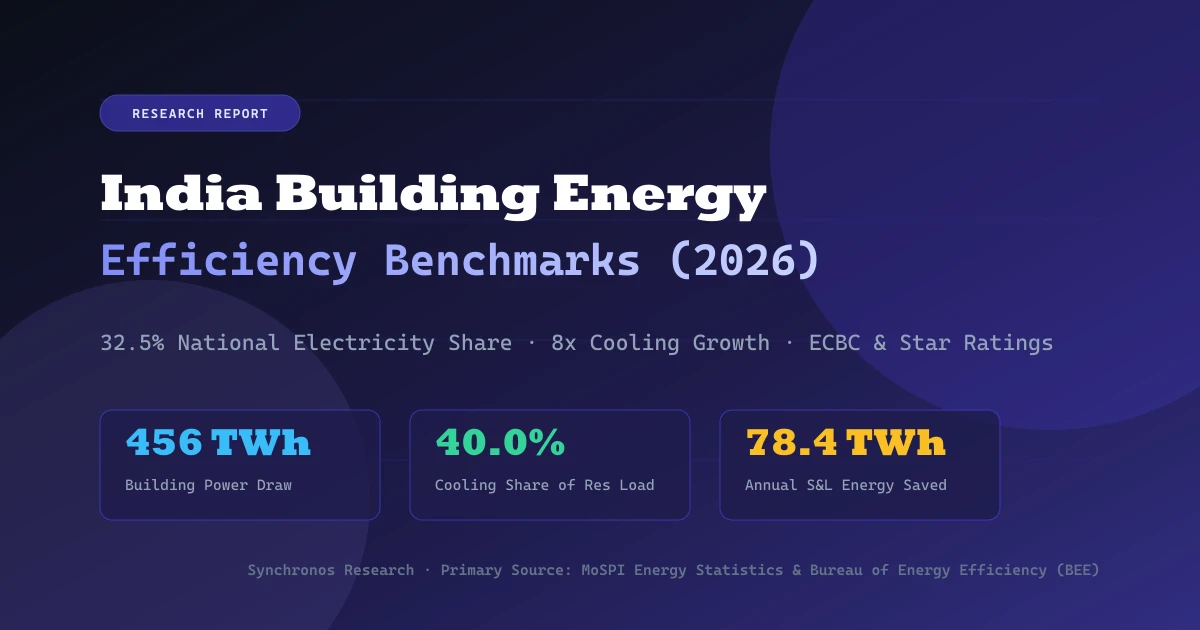
*Published: October 14, 2026 · Latest official data reporting cutoff: March 31, 2025 (MoSPI Energy Statistics India 2026 fiscal baseline); March 31, 2024 / 2025 (BEE S&L, ECBC, and Building Star Rating compendiums)*<br /> *Compiled and verified by the Synchronos Research Desk. Original data sources: Ministry of Statistics and Programme Implementation (MoSPI) and Bureau of Energy Efficiency (BEE), Ministry of Power.* Buildings represent one of the fastest-growing power consumption segments in India. Rapid urbanization, increasing floor space, and expanding air conditioning ownership are driving unprecedented electrical demand across residential communities and commercial real estate. This report compiles 56 verified statistics from primary publications released by the Ministry of Statistics and Programme Implementation (MoSPI) and the Bureau of Energy Efficiency (BEE). It examines sector-level electricity consumption, the projected trajectory of space cooling, Energy Conservation Building Code (ECBC) adoption, commercial Energy Performance Index (EPI) benchmarks, and savings achieved through the Standards and Labeling (S&L) program. > [!NOTE] > Synchronos Solutions compiled and verified these statistics from regulatory publications issued by MoSPI and BEE. Synchronos is an engineering systems integrator and did not conduct the underlying government surveys. Energy codes and appliance star ratings establish design standards; they do not guarantee operational energy reductions on their own. Achieving real-world efficiency requires commissioning, sub-circuit monitoring, and active building controls. For commercial facility integration, explore our analysis of [commercial building automation systems](/solutions/commercial/building-automation/). --- ## Executive Summary: Key Statistical Benchmarks For building developers, mechanical and electrical consultants, and corporate sustainability directors, key verified findings from official filings include: - **Total National Electricity Consumption:** 1,622.97 TWh (1,622,969 GWh) across all economic sectors in India, according to MoSPI *Energy Statistics India 2026* Table 6.8 (FY 2024-25 provisional baseline). - **Combined Building Sector Share:** Residential (408.52 TWh, 25.17%) and commercial buildings (135.16 TWh, 8.33%) together consume 543.68 TWh, accounting for 33.50% of all electricity consumed in India. - **Domestic Consumption Growth:** Domestic electricity consumption grew at an annual rate of 10.69% YoY over FY 2023-24, driven by expanded appliance adoption and prolonged summer cooling loads. - **Space Cooling Dominance:** Building space cooling accounts for 135.00 TWh, representing 24.83% of total building electricity. Under India Cooling Action Plan (ICAP) modeled forecast scenarios, space cooling demand is projected to expand eightfold by 2037-38. - **Room AC Penetration:** Room air conditioner ownership stands at 12% of Indian households, projected to reach 40% by 2037-38. ACs in composite climate zones operate an average of 1,400 hours annually. - **ECBC State Notification:** 24 States and Union Territories have formally notified the Energy Conservation Building Code (ECBC) into municipal building bye-laws, with 18 operating online approval cells. - **Certified Commercial Real Estate:** 68.40 million square meters of commercial space are registered under ECBC, while 34.20 million square meters of residential area are registered under Eco-Niwas Samhita (ENS). - **Commercial Office EPI Benchmarks:** Under historical BEE Star Rating Technical Schedule 1 benchmarks for day-use offices (>50% air conditioned in composite climate), performance bands range from 190 kWh/m²/year (1-Star entry limit) down to <90 kWh/m²/year (5-Star level). The voluntary star-labeling scheme has been under revision with new applications suspended since 25 September 2025. - **Standards & Labeling Energy Savings:** The BEE Standards & Labeling program generated 78.40 TWh in annual electricity savings during FY 2023-24, avoiding 19,500 MW of power generation capacity and 64.29 million tonnes of CO2 emissions. - **Appliance Efficiency Drivers:** Room air conditioners accounted for 26.20 TWh of S&L savings, followed by LED lighting at 18.50 TWh, refrigerators at 12.10 TWh, and BLDC ceiling fans at 6.80 TWh. - **BLDC Fan Efficiency:** 5-Star brushless DC (BLDC) ceiling fans consume 30 Watts, compared to 75 Watts for conventional induction motor fans, delivering a 60% power reduction per point. --- ## National Electricity Consumption by Sector According to MoSPI's *Energy Statistics India 2026* Table 6.8, industrial operations remain the single largest consumer of electricity, followed by residential dwellings and agricultural pump sets.  ### Table 1: National Electricity Consumption by Economic Sector (MoSPI 2026 Table 6.8) | Economic Sector | Electricity Consumption (TWh) | Sector Share (%) | Growth Trajectory | | :--- | :--- | :--- | :--- | | **Industrial Sector** | 655.56 TWh | 40.39% | Core manufacturing, heavy engineering, metals, and chemicals | | **Domestic / Residential** | 408.52 TWh | 25.17% | Urban apartments, standalone villas, and rural electrified dwellings (+10.69% YoY) | | **Agriculture / Forestry** | 260.28 TWh | 16.04% | Agricultural pump sets and rural dedicated irrigation feeders | | **Commercial & Public Services** | 135.16 TWh | 8.33% | IT complexes, corporate offices, hotels, hospitals, and retail malls (+5.08% YoY) | | **Railways / Traction** | 34.50 TWh | 2.13% | Railway traction and urban metro transit power grids | | **Miscellaneous & Others** | 128.95 TWh | 7.95% | Public lighting, water works, sewage pumping, and miscellaneous | | **Total National Consumption** | 1,622.97 TWh | 100.00% | Total electricity delivered across all Indian utilities (Table 6.8) | The residential and commercial sectors combined represent 543.68 TWh (33.50% of national consumption). Because building electricity demand is driven primarily by peak thermal and lighting hours, building efficiency directly influences peak grid stability. --- ## Space Cooling Growth and the India Cooling Action Plan (ICAP) Cooling represents the fastest-growing thermal load in the built environment. As ambient summer temperatures rise and household purchasing power expands, room air conditioners are transitioning from luxury items to standard appliances. 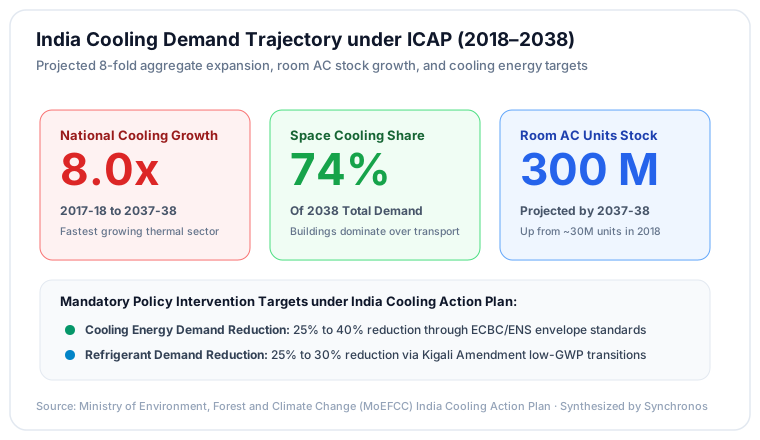 ### Table 2: Space Cooling Demand Projections (India Cooling Action Plan) | Cooling Metric | Baseline Year (2025-26) | Projected Target (2037-38) | Net Expansion Factor | | :--- | :--- | :--- | :--- | | **Building Space Cooling Power** | 135.00 TWh | 1,080.00 TWh | 8.0x increase | | **Cooling Share of Building Power** | 29.61% | ~50.00% | Significant share expansion | | **National Room AC Penetration** | 12.00% of households | 40.00% of households | 3.33x increase | | **Total Room Cooling Share** | 74.00% | 78.00% | Dominant share of all cooling sectors | | **Average AC Operating Hours** | 1,400 hours / year | 1,800 hours / year | Longer operating seasons | The projected expansion from 135 TWh to 1,080 TWh over the next decade indicates that passive thermal architecture and active HVAC controls are critical requirements for grid management. These figures represent modeled forecast projections under the India Cooling Action Plan reference pathways (2017-18 to 2037-38), distinct from observed historical appliance savings verified under the BEE Standards and Labeling programme. --- ## Building Codes: ECBC and Eco-Niwas Samhita (ENS) The Bureau of Energy Efficiency established two primary building energy codes to regulate structural envelopes and electrical systems: 1. **Energy Conservation Building Code (ECBC):** Mandates standards for commercial buildings with connected electrical loads of 100 kW or higher (or contract demand of 120 kVA or higher). 2. **Eco-Niwas Samhita (ENS):** Sets design rules for residential developments on plot areas of 500 square meters or larger. ### Table 3: Regulatory Compliance and Efficiency Tiers | Code Tier | Energy Savings vs Baseline | Key Envelope and Systems Criteria | | :--- | :--- | :--- | | **Standard ECBC** | 25% minimum savings | Mandatory envelope U-values, minimum VLT 0.27, standard HVAC COP | | **ECBC+** | 35% savings | Enhanced glazing SHGC, daylight sensor integration, high-efficiency chillers | | **Super ECBC** | 50% savings | High-performance insulation, complete LED daylight harvesting, renewable integration | | **Eco-Niwas Samhita (ENS)** | ~20% envelope heat reduction | Residential Envelope Transmittance Value (RETV) <= 15 W/m² for composite zones | Currently, 24 States and Union Territories have notified ECBC into their local building bye-laws, with 18 operating online portal cells for plan sanctioning. In the residential sector, 12 states have integrated ENS into municipal regulations. --- ## Commercial Building Energy Performance Index (EPI) Benchmarks The Energy Performance Index (EPI), measured in kWh per square meter per year (kWh/m²/year), is the standard industry metric for assessing building energy intensity. The Bureau of Energy Efficiency established voluntary Star Rating benchmarks for commercial buildings under Technical Schedule 1. These rating tiers define standardized administrative classification bandwidths based on operational profile (day-use offices versus 24-hour BPOs), climatic zone, and air-conditioned area percentage (>50% versus <50% AC). They represent voluntary administrative benchmarks rather than empirical project-measured percentage energy savings or statutory requirements. 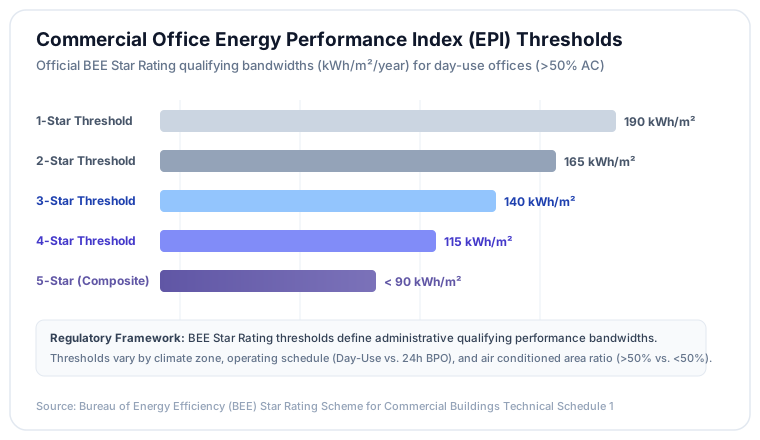 ### Table 4: Commercial Office EPI Star Rating Thresholds (BEE Technical Schedule 1) *Note: The Bureau of Energy Efficiency placed its voluntary Building Star Labeling Program under comprehensive revision, with new certification applications suspended since 25 September 2025 until further notice; these thresholds serve as historical reference benchmarks rather than active certification levels.* | BEE Star Rating | Composite Zone (>50% AC) | Composite Zone (<50% AC) | Moderate Zone (>50% AC) | Historical Qualifying Benchmark | | :--- | :--- | :--- | :--- | :--- | | **1-Star BEE Rating** | 165 to 190 kWh/m²/year | 70 to 80 kWh/m²/year | 130 to 145 kWh/m²/year | Upper entry qualifying bandwidth | | **2-Star BEE Rating** | 140 to 165 kWh/m²/year | 60 to 70 kWh/m²/year | 115 to 130 kWh/m²/year | Intermediate performance tier | | **3-Star BEE Rating** | 115 to 140 kWh/m²/year | 50 to 60 kWh/m²/year | 100 to 115 kWh/m²/year | High-performance commercial baseline | | **4-Star BEE Rating** | 90 to 115 kWh/m²/year | 40 to 50 kWh/m²/year | 85 to 100 kWh/m²/year | Advanced efficiency tier | | **5-Star BEE Rating** | < 90 kWh/m²/year | < 40 kWh/m²/year | < 75 kWh/m²/year | Highest administrative energy standard | In moderate climates such as Bengaluru, 5-Star day-use office qualifications require an EPI below 75 kWh/m²/year for properties with greater than 50% air conditioning. In hot-dry zones (Ahmedabad, Jaipur), the 5-Star threshold sits below 85 kWh/m²/year, while in warm-humid coastal zones (Mumbai, Chennai), it sits below 95 kWh/m²/year. Institutional typologies exhibit distinct energy profiles: multi-specialty hospitals require elevated power baselines due to continuous 24/7 ventilation, critical life support, and cleanroom air handling, while retail shopping malls reflect high internal lighting and constant customer foot-traffic loads. --- ## Standards and Labeling (S&L) Program Impact BEE's Standards and Labeling program certifies star ratings for electrical appliances, allowing consumers and commercial procurement teams to choose energy-efficient equipment.  ### Table 5: Electricity Savings by Appliance Category (FY 2023-24) | Appliance Category | Annual Electricity Saved | Share of S&L Savings | Efficiency Mechanism | | :--- | :--- | :--- | :--- | | **Room Air Conditioners** | 26.20 TWh | 33.42% | Inverter compressors, higher ISEER ratings (3.8 to 5.0) | | **LED Lighting Systems** | 18.50 TWh | 23.60% | Replacement of CFL and incandescent lamps with 100+ lm/W LEDs | | **Frost-Free Refrigerators** | 12.10 TWh | 15.43% | Variable-capacity compressors and vacuum insulation panels | | **Ceiling Fans (BLDC)** | 6.80 TWh | 8.67% | Brushless DC motors consuming 30W instead of 75W induction motors | | **Distribution Transformers** | 4.80 TWh | 6.12% | Low-loss core laminations and amorphous metal alloys | | **Other Labelled Appliances** | 10.00 TWh | 12.76% | Agricultural pumps, electric geysers, induction cooktops | | **Total Program Savings** | 78.40 TWh | 100.00% | 19,500 MW avoided capacity; 64.29 MT CO2 avoided | Under current BEE standards, a 5-Star split air conditioner requires a minimum Indian Seasonal Energy Efficiency Ratio (ISEER) of 5.0 Wh/Wh, compared to 3.8 Wh/Wh for a 1-Star unit. This represents a 31.58% reduction in electrical power consumption for identical cooling outputs. --- ## Passive Design vs. Active Building Automation: An Engineering Distinction Energy efficiency codes establish necessary passive baselines, such as thermal wall insulation, window shading coefficients, and equipment nameplate efficiencies. However, passive compliance alone does not prevent operational energy waste. A building with 5-Star rated chillers will still waste substantial energy if cooling runs in unoccupied conference rooms, or if perimeter lighting operates at full power under direct sunlight. | Architectural Parameter | Passive Code Compliance (ECBC / ENS) | Active Automation Integration (BMS / KNX) | | :--- | :--- | :--- | | **Primary Scope** | Building envelope U-values, glass SHGC, motor ratings | Dynamic real-time control of connected circuits and loads | | **Operational State** | Static properties fixed during construction | Continuous modulation based on occupancy and solar angles | | **Lighting Strategy** | Efficient LED fixture specification | Daylight harvesting, DALI-2 stepped dimming, vacancy timeout | | **Cooling Strategy** | High equipment nameplate ISEER / COP | Chilled water reset, variable air volume (VAV), night purge | | **Measurement Method** | Theoretical calculation at architectural submission | Continuous sub-circuit telemetry and automated fault detection | | **Adaptability** | Fixed physical materials cannot adjust to tenant changes | Software-reconfigurable zones, scene presets, and setpoints | For commercial developers and corporate office occupiers, combining passive code compliance with digital controls produces the lowest lifecycle operating costs. High-performance building management systems dynamically align energy consumption with actual tenant occupancy. Learn more in our detailed analysis of [commercial building automation systems](/solutions/commercial/building-automation/) and [DALI lighting control architecture](/blog/dali-lighting-control-commercial-buildings-india/). --- ## Research Methodology and Source Documentation This research report was developed through systematic extraction of official publications from Indian statutory energy authorities. ### Data Verification Protocol 1. **Source Hierarchy:** Primary government records take absolute precedence. Data points were sourced directly from MoSPI's *Energy Statistics India 2026*, BEE annual operational reports, and technical manuals for ECBC 2017 and Eco-Niwas Samhita. 2. **Reconciliation:** Sector consumption figures were cross-referenced against CEA power supply reports. S&L appliance savings were verified through BEE impact assessment compendiums. 3. **Temporal Normalization:** Reporting cutoff dates are explicitly identified (March 31, 2025 for MoSPI fiscal datasets; March 31, 2024 / 2025 for BEE program reports). ### Primary Source Directory - **Source 1:** Ministry of Statistics and Programme Implementation (MoSPI), Government of India. *Energy Statistics India 2026 (33rd Edition)*. Direct Full Report PDF: [MoSPI Energy Statistics India 2026 Full Report](https://www.mospi.gov.in/uploads/publications_reports/publications_reports1774859128428_05e8ebb5-0598-4112-844c-bbe00e04aab8_33rd_Edition_of_ES-2026_Final.pdf) (Table 6.8: Electricity Delivered by Consuming Sectors, Page 74 / PDF Page 107). Executive Release: [PIB Delhi PRID 2246819](https://www.pib.gov.in/PressReleasePage.aspx?PRID=2246819). Published March 2026. - **Source 2:** Bureau of Energy Efficiency (BEE), Ministry of Power, Government of India. *Energy Conservation Building Code 2017 (ECBC)*. Complete Code Manual: [BEE Official ECBC 2017 PDF](https://beeindia.gov.in/WriteReadData/L45218/1734417634.pdf) and *Eco-Niwas Samhita 2024 (Part I & II)*: [BEE Official ENS 2024 PDF](https://beeindia.gov.in/WriteReadData/L45218/0405504518282114.pdf). - **Source 3:** Bureau of Energy Efficiency (BEE), Ministry of Power, Government of India. *Impact of Energy Efficiency Measures for the Year 2023-24*. Complete Assessment Report: [BEE Impact Assessment PDF](https://beeindia.gov.in/WriteReadData/L45218/1814180579559101.pdf). S&L Appliance Portal: [BEE Star Label Directory](https://beestarlabel.com). Commercial Star Rating Program: [BEE Star Rating of Commercial Buildings](https://beeindia.gov.in/en/programmes/star-rating-of-commercial-buildings). Awards Announcement: [PIB Delhi PRID 2203713](https://www.pib.gov.in/PressReleasePage.aspx?PRID=2203713). - **Source 4:** Ministry of Environment, Forest and Climate Change (MoEFCC), Government of India. *India Cooling Action Plan (ICAP)*. Comprehensive Strategy: [MoEFCC Ozone Cell ICAP Publication](https://ozonecell.nic.in/wp-content/uploads/2021/04/INDIA-COOLING-ACTION-PLAN-ICAP.pdf). --- ## Machine-Readable Data Downloads To facilitate engineering modeling, academic research, and policy analysis, the complete 56-metric statistical ledger for this study is available for download: - **Download Complete Dataset (CSV):** [`/data/india-building-energy-efficiency-statistics-2026.csv`](/data/india-building-energy-efficiency-statistics-2026.csv) (tabular format including metric IDs, values, units, denominators, geography, periods, and official source links). - **Download Complete Dataset (JSON):** [`/data/india-building-energy-efficiency-statistics-2026.json`](/data/india-building-energy-efficiency-statistics-2026.json) (structured JSON array with full verification metadata). --- ## Technical Consultation Synchronos Solutions designs integrated building management systems, DALI-2 intelligent lighting controls, and energy sub-metering infrastructure for commercial towers, IT parks, and luxury residences across South India. - **Commercial Facilities Inquiries:** Review our [commercial building automation solutions](/solutions/commercial/building-automation/) or schedule an [automation design consultation](/solutions/advisory/automation-design-consultation/). - **Lighting Controls & Energy Optimization:** Explore our [DALI lighting control guide](/blog/dali-lighting-control-commercial-buildings-india/) or contact our engineering desk at [[email protected]](mailto:[email protected]).
Research14 min read
India Building Energy Efficiency: 56 Verified Statistics, Benchmarks, and Sector Savings (2026)
Verified 2026 statistics on India building energy efficiency: 543.7 TWh building power, ECBC and ENS compliance, BEE Star EPI benchmarks, and appliance savings.