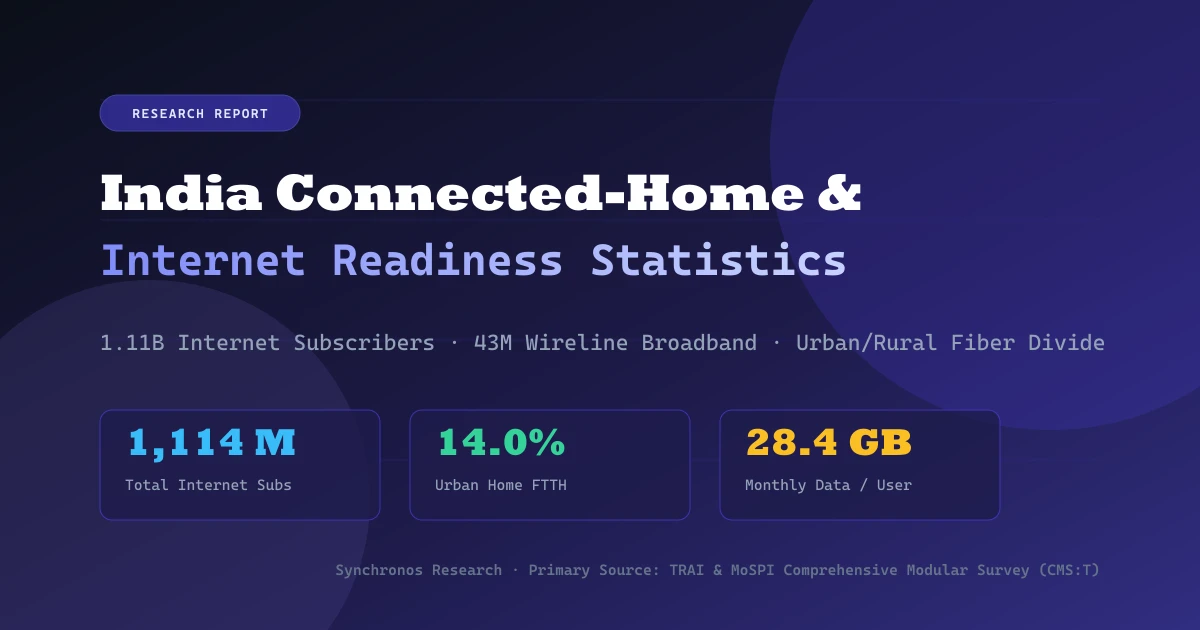
Published: October 14, 2026 · Latest official data reporting cutoff: June 30, 2026 (TRAI Quarterly Telecom Indicators); March 31, 2026 (TRAI Yearly Performance Indicators); May 2025 (MoSPI NSS 80th Round CMS:T)
India operates the second-largest telecommunications market in the world. As commercial property developers, architects, and homeowners evaluate smart building technologies, understanding the underlying network infrastructure is essential. Reliable automated controls require resilient local communication pathways, stable backhaul connectivity, and adequate bandwidth.
This report compiles 60 verified statistical observations from official filings published by the Telecom Regulatory Authority of India (TRAI) and the Ministry of Statistics and Programme Implementation (MoSPI). It analyzes national subscriber growth, wireless versus fixed broadband distribution, the urban-rural tele-density divide, household device penetration, monthly data usage, and market concentration.
[!NOTE] Synchronos Solutions compiled and verified these statistics from regulatory filings issued by TRAI and MoSPI. Synchronos is an engineering systems integrator and did not execute the national census. Telecommunications connectivity must not be confused with private smart home adoption. A household with high-speed broadband or smartphone access does not automatically possess automated lighting, motorized shades, or integrated climate control. For residential control architectures, consult our guide to residential smart home systems.
Executive Summary: Key Statistical Benchmarks
For technology researchers, telecommunications analysts, and real estate planners, key baseline metrics verified from official filings include:
- Total Internet Subscribers (June 30, 2026): 1,114.17 million (1.11 billion) active internet subscriptions reported by licensed service providers across wireline and wireless networks, expanding from 1,092.79 million at the close of FY 2025-26 and 969.10 million in March 2025. These figures reflect licensed subscriptions rather than unique individual users.
- Annual Subscriber Growth Rate: 12.76% net expansion across FY 2025-26, supported by continuing 5G mobile deployments and suburban fiber rollouts.
- National Internet Tele-Density: 77.94 subscribers per 100 population as of June 30, 2026, up from 76.59 in March 2026.
- Wired vs. Wireless Asymmetry: Wireless internet subscriptions account for 1,066.43 million (95.72% of the market), whereas wired fixed-line internet accounts for 47.73 million (4.28%).
- Broadband Dominance: Broadband connections (defined by TRAI as download speeds of 2 Mbps or higher) represent 1,087.50 million subscriptions, or 97.61% of all internet connections.
- Fixed Broadband Base: Fixed-line wired broadband reached 47.71 million connections (4.39% of total broadband), demonstrating that physical fiber infrastructure remains concentrated in high-density urban residential pockets. Together with 0.022 million wired narrowband lines, total wired internet stands at 47.73 million subscriptions.
- Urban-Rural Divide: Urban areas account for 666.09 million internet subscribers with an internet tele-density of 129.03 per 100 population. Rural areas account for 448.08 million subscribers with a tele-density of 49.07 per 100 population, creating an absolute gap of 79.96 percentage points.
- Household Internet Presence (MoSPI Survey): 86.3% of Indian households report internet access within premises (91.6% in urban areas versus 83.3% in rural communities).
- Fiber-to-the-Home (FTTH) Household Reality: Only 6.8% of Indian households nationwide possess a dedicated optical fiber connection (14.0% in urban areas and 3.2% in rural areas), highlighting that the vast majority of residential internet access relies on mobile cellular data.
- Smartphone Penetration: 85.5% of households possess at least one smartphone (91.3% urban, 82.1% rural). Overall mobile phone possession (basic or smart) stands at 96.6% urban and 94.4% rural.
- Monthly Data Consumption per Subscriber: Average wireless data consumption reached 28.39 GB per subscriber per month in the quarter ending June 30, 2026, rising 18.49% year-on-year from 21.53 GB in FY 2024-25. Total quarterly wireless data traffic reached 84.42 exabytes (84,424 PB).
- Carrier Consolidation: Reliance Jio and Bharti Airtel collectively account for 84.85% of wireless internet subscriptions (48.54% and 36.31% respectively) and 53.84% of wired internet subscriptions (30.53% and 23.31% respectively).
National Internet Subscriber Growth Trajectory
India's internet subscription base has expanded steadily across consecutive reporting quarters. The transition from legacy narrowband connections to 4G and 5G networks, combined with affordable data plans, has expanded connectivity across metropolitan centers, tier-2 cities, and rural administrative blocks.
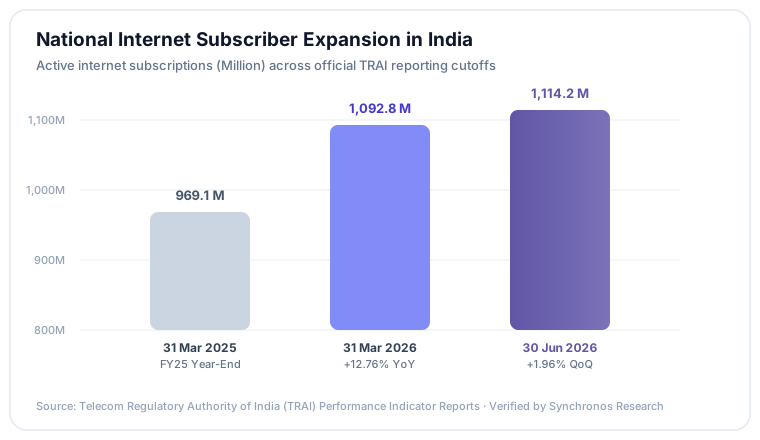
Table 1: National Internet and Broadband Subscriptions across Official Reporting Periods
| Reporting Metric | June 30, 2026 (QE June 2026) | March 31, 2026 (FY26 Closing) | March 31, 2025 (FY25 Closing) | Net Annual Change | |||||
| Total Internet Subscribers | 1,114.17 Million | 1,092.79 Million | 969.10 Million | +123.69 Million (+12.76%) | |||||
| Broadband Subscribers (>= 2 Mbps) | 1,087.50 Million | 1,065.88 Million | 944.12 Million | +121.76 Million (+12.90%) | |||||
| Narrowband Subscribers (< 2 Mbps) | 26.67 Million | 26.91 Million | 24.98 Million | +1.93 Million | |||||
| National Internet Tele-Density | 77.94 per 100 pop | 76.59 per 100 pop | 68.80 per 100 pop | +7.79 points | |||||
| Total Wireless Data Traffic (Quarter) | 84.42 Exabytes | 77.95 Exabytes | 66.80 Exabytes | +17.62 Exabytes | |||||
| Monthly Data Usage per Subscriber | 28.39 GB / month | 26.70 GB / month | 21.53 GB / month | +5.17 GB / month (+18.49%) |
Broadband subscriptions account for 97.61% of all active connections in India, demonstrating that legacy narrowband connections (speeds below 2 Mbps) have been phased out across major commercial networks.
Wired versus Wireless Distribution: The Infrastructure Reality
A critical consideration for connected facilities is the distribution between wired physical lines and wireless cellular connectivity. While wireless data allows basic smartphone interaction, high-density building automation, enterprise IP cameras, and uncompressed multi-room audio depend heavily on fixed wired backbones.

Table 2: Breakdown of Internet and Broadband by Medium (June 30, 2026)
| Network Medium | Total Internet (Million) | Share of Total Internet | Broadband Only (Million) | Share of Total Broadband | |||||
| Wireless (Mobile 4G/5G, Fixed Wireless) | 1,066.43 M | 95.72% | 1,039.79 M | 95.61% | |||||
| Wired / Fixed-Line (FTTH, DSL, Cable) | 47.73 M | 4.28% | 47.71 M | 4.39% | |||||
| Total National Subscriptions | 1,114.17 M | 100.00% | 1,087.50 M | 100.00% |
Fixed-line broadband represents 47.71 million connections nationwide, within a total wired internet base of 47.73 million subscriptions (the remaining 0.022 million operating at narrowband speeds below 2 Mbps). Although wireline subscriber numbers have expanded through urban fiber rollouts, wired broadband accounts for only 4.39% of all broadband subscriptions in India. For residential and commercial automation engineers, this structural reality explains why systems designed for Indian properties must operate independently of cloud connectivity for local core functions.
Geographic Distribution and the Urban-Rural Divide
Telecom penetration differs markedly between urban commercial clusters and rural districts. While urban tele-density exceeds 100% due to multi-SIM usage and dual corporate-personal connections, rural internet tele-density remains under 50%.

Table 3: Urban and Rural Telecommunications Distribution (TRAI June 30, 2026)
| Geographic Dimension | Internet Subscribers | Share of National Total | Internet Tele-Density | Telecom Circle Distribution | |||||
| Urban Segment | 666.09 Million | 59.78% | 129.03 per 100 population | Concentrated in Metros and Tier-1 cities | |||||
| Rural Segment | 448.08 Million | 40.22% | 49.07 per 100 population | Spread across 600,000+ village administrative units | |||||
| National Total / Ratio | 1,114.17 Million | 100.00% | 77.94 per 100 population | Urban-to-Rural Ratio: 1.49x (Tele-density Gap: 79.96 pts) |
The urban internet tele-density of 129.03 reflects significant device density per person in metropolitan centers such as Delhi, Bengaluru, Mumbai, and Hyderabad. In contrast, rural tele-density of 49.07 demonstrates that more than half of rural residents do not hold an independent data subscription, even though many access family devices.
Household Access and Hardware Ownership: MoSPI Survey Findings
The Ministry of Statistics and Programme Implementation (MoSPI) conducted the Comprehensive Modular Survey on Telecom (CMS:T) under the NSS 80th Round, capturing nationwide household-level adoption data.
Table 4: Household Connectivity and Hardware Ownership (MoSPI CMS:T 2025)
| Survey Indicator | All-India Average | Urban Households | Rural Households | Difference (Urban vs Rural) | |||||
| Households with Internet Access | 86.3% | 91.6% | 83.3% | +8.3 percentage points | |||||
| Households with Optical Fiber (FTTH) | 6.8% | 14.0% | 3.2% | +10.8 percentage points | |||||
| Households Owning at Least 1 Smartphone | 85.5% | 91.3% | 82.1% | +9.2 percentage points | |||||
| Households Owning Any Mobile Phone | 95.2% | 96.6% | 94.4% | +2.2 percentage points | |||||
| Youth (15-29) Capable of Digital UPI Payments | 99.5% | 99.7% | 99.3% | +0.4 percentage points |
The MoSPI findings show that while 86.3% of Indian households have internet access within their living quarters, only 6.8% possess an optical fiber (FTTH) line. In urban environments, FTTH penetration reaches 14.0%, while in rural areas it drops to 3.2%. Consequently, over 90% of Indian households depend entirely on cellular wireless hotspots or mobile data handsets for residential internet access.
Data Consumption Trends and Carrier Concentration
Data usage per subscriber in India has grown steadily, driven by video streaming, social communication, and cloud applications.
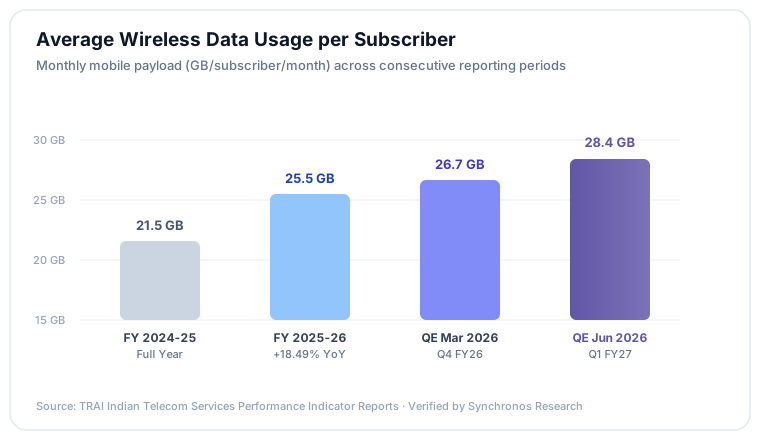
Table 5: Market Share of Leading Telecom Service Providers (TRAI 2026)
| Service Provider | Wireless Internet Share | Wired Internet Share | Primary Network Standards | ||||
| Reliance Jio Infocomm | 48.54% (517.63 M) | 30.53% (14.57 M) | 4G LTE, 5G Standalone (SA), FTTH | ||||
| Bharti Airtel | 36.31% (387.18 M) | 23.31% (11.13 M) | 4G LTE, 5G Non-Standalone (NSA), FTTH | ||||
| Vodafone Idea (Vi) | 12.75% (135.98 M) | < 1.00% (Enterprise) | 4G LTE, Enterprise wireline | ||||
| Bharat Sanchar Nigam Ltd (BSNL) | 2.38% (25.37 M) | 9.50% (4.53 M) | 3G/4G, National copper & FTTH | ||||
| Other Private ISPs (ACT, Kerala Vision, etc.) | 0.02% (0.27 M) | 36.66% (17.50 M) | Metro fiber and cable broadband networks |
Reliance Jio and Bharti Airtel hold a combined 84.85% share of wireless internet subscriptions and 53.84% of wired internet subscriptions. Average monthly wireless data usage per subscriber reached 28.39 GB in the quarter ending June 30, 2026, generating a blended monthly Average Revenue Per User (ARPU) of Rs. 187.12.
Connectivity vs. Smart Home Automation: A Technical Distinction
A common misconception in market research reports is conflating high internet tele-density or smartphone ownership with residential smart home automation.
An active mobile broadband connection enables a smartphone to communicate with remote cloud servers. It does not establish an automated living environment. Real smart home automation involves physical sensor networks, fieldbus actuators, power relays, local microcontrollers, and dedicated protocol gateways.
| Technical Dimension | Consumer Internet Access | Integrated Building Automation | |||
| Primary Physical Layer | 4G/5G Cellular, Wi-Fi 5/6 routers | KNX TP, DALI-2, Zigbee 3.0, BACnet/IP, Cat6A | |||
| Network Architecture | Cloud-dependent client-server model | Local edge processing; independent of WAN | |||
| Latency Benchmark | 30 to 120 milliseconds (cellular transit) | Under 10 milliseconds (deterministic bus) | |||
| Failure Mode | WAN outage disables device communication | Local lighting, shades, and climate run uninterrupted | |||
| Hardware Topology | Single wireless router with dynamic DHCP | Hardwired DIN-rail controllers and isolated VLANs | |||
| Control Resolution | Individual device app or basic voice command | Coordinated multi-system scenes and sensor events |
Homeowners and architects planning connected residences should build robust local network backbones. Wi-Fi consumer devices can congest residential routers when scaled to dozens of endpoints. Professional automation separates mission-critical building controls onto dedicated, hardwired fieldbuses that function reliably regardless of external internet availability. Learn more in our technical guide to residential Wi-Fi 6 network backbones.
Research Methodology and Source Documentation
This research report was developed through systematic extraction and cross-verification of official records published by Indian regulatory and statistical authorities.
Data Verification Protocol
- Source Precedence: Sourced strictly from statutory bodies: the Telecom Regulatory Authority of India (TRAI) and the Ministry of Statistics and Programme Implementation (MoSPI).
- Reconciliation: Metrics across quarterly indicator releases were cross-referenced against yearly compendiums. Totals were checked against state circle aggregations.
- Temporal Normalization: Reporting cutoff dates are explicitly stated for each metric (June 30, 2026 for quarterly indicators; March 31, 2026 for fiscal year closing; May 2025 for NSS 80th Round CMS:T household survey data).
Primary Source Directory
- Source 1: Telecom Regulatory Authority of India (TRAI). The Indian Telecom Services Performance Indicators April – June, 2026. Complete Official Report: TRAI Document Repository (node/18773). Supporting Executive Summary: PIB Delhi Press Release PRID 2322388. Published October 12, 2026.
- Source 2: Ministry of Statistics and Programme Implementation (MoSPI), Government of India. Comprehensive Modular Survey: Telecom, NSS 80th Round (January – March 2025). New Delhi: National Sample Survey Office, published May 2025. PIB Delhi Press Release PRID 2132330
- Source 3: Department of Telecommunications (DoT), Ministry of Communications. Gazette Notification on Revised Broadband Definition (2 Mbps Threshold). New Delhi: Gazette of India. PIB Delhi Notification PRID 1893323
Machine-Readable Data Downloads
To assist data analysts, journalists, and network engineers, the complete 60-metric statistical ledger for this study is available in open formats:
- Download Complete Dataset (CSV):
/data/india-connected-home-internet-statistics-2026.csv(tabular format including metric IDs, values, units, denominators, geography, periods, and official source links). - Download Complete Dataset (JSON):
/data/india-connected-home-internet-statistics-2026.json(structured JSON array with full verification metadata).
Technical Consultation
Synchronos Solutions designs resilient enterprise network backbones, structured cabling systems, and smart home automation infrastructure for luxury residences, commercial facilities, and hospitality developments across South India.
- Network Infrastructure Inquiries: Explore our residential network design solutions or schedule an automation design consultation.
- Integrated Smart Living: Review our luxury home automation systems or speak directly with an engineer at [email protected].