Published: October 14, 2026 · Latest official data reporting cutoff: August 3, 2026 (national scheme aggregates); December 31, 2025 (28-state utility census)
Smart electricity metering represents one of the largest infrastructure modernizations in India's public utility sector. In July 2021, the Government of India launched the Revamped Distribution Sector Scheme (RDSS) with a dedicated Part-A allocation for Advanced Metering Infrastructure (AMI). The stated operational objective is simple: reduce utility distribution losses, replace manual meter reading with automated telemetry, and shift consumer billing to prepaid collection.
This report compiles 93 verified observations from primary government records. It documents national sanctions, actual on-site deployments, category breakdowns across consumer, distribution transformer (DT), and feeder meters, Discom loss metrics, and state-by-state progress across 28 participating States and Union Territories.
[!NOTE] Synchronos Solutions compiled, calculated, and visualized these statistics from public records issued by the Ministry of Power, REC Limited, Power Finance Corporation (PFC), and the Central Electricity Authority. Synchronos is an independent engineering firm and did not conduct the state utility census. Smart grid electricity meters installed by power utilities differ fundamentally from private residential building automation systems. Smart meters record and transmit billing data to utilities; they do not control interior climate, automate architectural lighting, or adjust sub-circuit loads. For private facility controls, consult our guide to commercial building automation systems.
Executive Summary: Key Statistical Benchmarks
For journalists, energy analysts, and utility planners, the primary verified findings from official filings include:
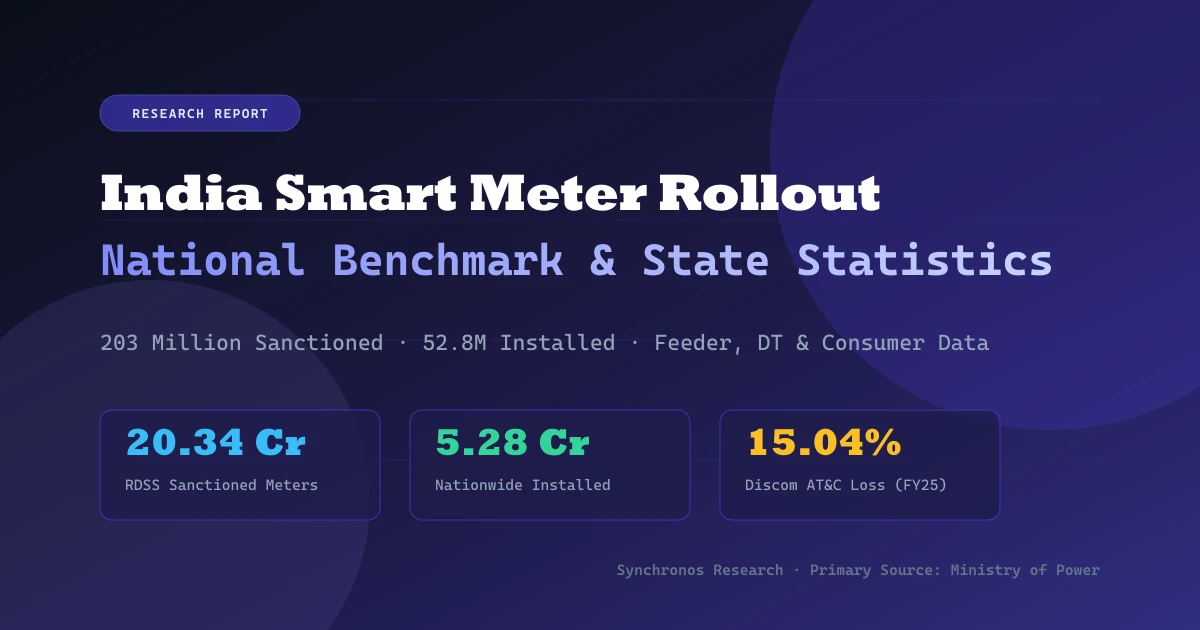
- Total Sanctioned RDSS Volume: 20,33,88,297 (20.34 crore) smart meters sanctioned across 45 electricity distribution utilities in 28 States and Union Territories.
- RDSS Actual Installed Base (December 31, 2025): 3,90,71,916 (3.91 crore) meters installed on-site, representing an overall national RDSS execution rate of 19.21%.
- All-Schemes National Total (December 31, 2025): 5,28,00,000 (5.28 crore) meters installed across all active and legacy programs (RDSS, NSGM, IPDS, DDUGJY, and state self-funded Discom initiatives).
- Two-Week Milestone Update (January 15, 2026): 4,05,00,000 (4.05 crore) meters installed under RDSS and 5,44,00,000 (5.44 crore) meters installed nationwide across all schemes.
- National Milestone (August 3, 2026): Cumulative nationwide installations reached 7,24,00,000 (7.24 crore) meters across all schemes, of which 5,73,00,000 (5.73 crore) operate under RDSS contracts.
- Feeder vs. Consumer Progress (December 31, 2025): Feeder smart meters achieved 77.13% installation completion (1,58,479 installed against 2,05,475 sanctioned). Consumer retail meters reached 19.03% completion (3,76,56,989 installed against 19,79,30,130 sanctioned). Distribution Transformer (DT) meters reached 23.92% (12,56,448 installed against 52,52,692 sanctioned).
- State Deployment Leader (Volume): Maharashtra leads all states in absolute installed volume with 83,71,606 meters installed (34.87% of its 2,40,04,866 sanctioned allocation).
- State Execution Leader (Completion Rate): Bihar records the highest completion rate among major states at 82.92% (21,61,981 installed against 26,07,153 sanctioned), followed by Assam at 73.43% (47,32,939 installed against 64,45,127 sanctioned).
- Zero-Installation States: Five jurisdictions recorded zero RDSS installations as of December 31, 2025: Andaman & Nicobar (84,835 sanctioned), Delhi (3,521 sanctioned under RDSS; private utilities executed independent deployments), Goa (7,50,356 sanctioned), Meghalaya (4,72,743 sanctioned), and Punjab (89,81,414 sanctioned).
- Utility Loss Reduction Trajectory: India's national Aggregate Technical and Commercial (AT&C) losses improved from 21.91% in FY 2020-21 to 15.04% in FY 2024-25, marking a net reduction of 6.87 percentage points. This reduction reflects the collective impact of multi-pronged distribution sector reforms, where smart metering is one contributing initiative alongside feeder segregation and tariff adjustments.
- Discom Financial Turnaround: Distribution utilities on an aggregate basis achieved a profit after tax of Rs. 2,701 crore in FY 2024-25, the first aggregate profit recorded since the Electricity Act, 2003.
- Consumer App Awareness: In an official survey of 1,24,590 consumers who downloaded utility mobile apps, 43.60% (54,321 consumers) were aware of real-time consumption monitoring features, while 58.19% (72,494 consumers) were aware of mobile recharge and payment options. These metrics evaluate consumer feature awareness rather than active daily usage or transaction frequency.
National Rollout Trajectory: Reporting Periods and Deadlines
The Revamped Distribution Sector Scheme was designed with an original closure target of March 31, 2026. Following contracting delays, vendor empanelment negotiations, and field integration hurdles, the government confirmed that the installation of sanctioned smart meters is to be completed by the end of the scheme period in March 2028.
Official filings across Parliament and the Press Information Bureau document steady quarterly expansion from mid-2025 through August 2026.
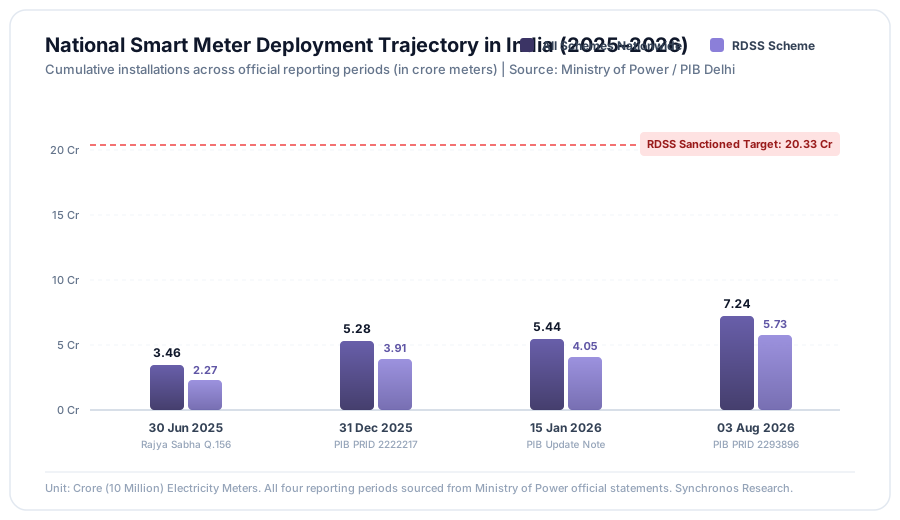
Table 1: Cumulative Smart Meter Installations across Official Reporting Periods
| Reporting Milestone | Date / Period | RDSS Installed (Crore) | All Schemes Nationwide (Crore) | Primary Source | Source Verification ID | ||||||
| FY26 Q1 Parliamentary Reply | 30 June 2025 | 2.27 (2,27,00,000) | 3.46 (3,46,00,000) | Rajya Sabha Q.156 | IND-SM-009 / IND-SM-010 | ||||||
| Official Year-End Cutoff | 31 December 2025 | 3.91 (3,90,71,916) | 5.28 (5,28,00,000) | PIB Delhi PRID 2222217 | IND-SM-005 / IND-SM-011 | ||||||
| Rajya Sabha Written Update | 15 January 2026 | 4.05 (4,05,00,000) | 5.44 (5,44,00,000) | PIB PRID 2222217 Note | IND-SM-012 / IND-SM-013 | ||||||
| Rajya Sabha Policy Statement | 03 August 2026 | 5.73 (5,73,00,000) | 7.24 (7,24,00,000) | PIB Delhi PRID 2293896 | IND-SM-014 / IND-SM-015 | ||||||
| Sanctioned Target Baseline | March 2028 (Deadline) | 20.33 (20,33,88,297) | Open Program | Rajya Sabha Q.156 / PIB 2222217 | IND-SM-001 / IND-SM-029 |
The difference between the RDSS figure and the all-schemes total (1.37 crore meters as of December 31, 2025, expanding to 1.51 crore meters as of August 3, 2026) represents smart meters deployed under state government plans, legacy pilot programs, and capital investments funded directly by distribution utilities.
Category Analysis: Consumer, Transformer, and Feeder Deployments
A frequent error in media coverage is treating all smart meters as household devices. Under the RDSS technical specification, metering occurs across three distinct grid tiers:
- Feeder Meters (11kV / 33kV): Installed inside utility substations to measure total electricity dispatched into a distribution feeder.
- Distribution Transformer (DT) Meters: Installed on the secondary side of street transformers to measure energy flowing into specific neighborhoods.
- Consumer Meters: Installed at the retail boundary of residential, commercial, and industrial properties.
Comparing the progress of these three categories reveals where utility execution has succeeded and where field friction remains acute.
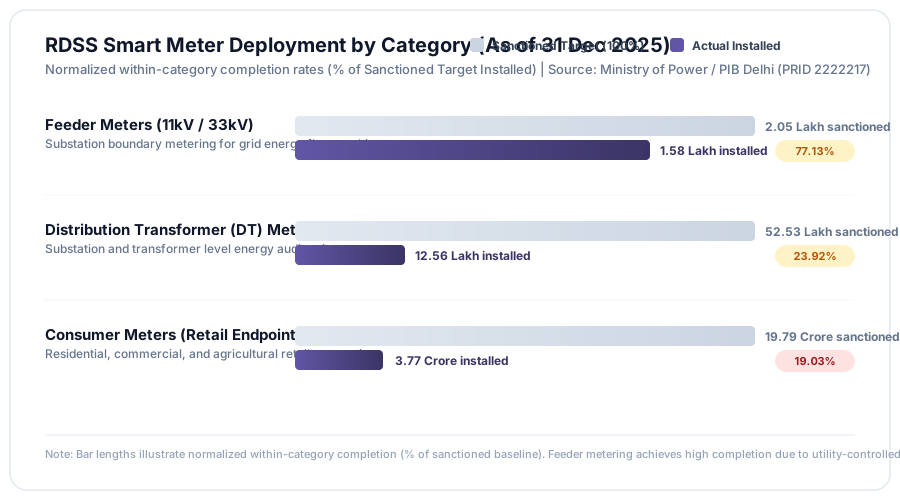
Table 2: RDSS Meter Breakdown by Functional Category (as of December 31, 2025)
| Meter Category | Sanctioned (Nos.) | Installed (Nos.) | Completion Rate (%) | Primary Operational Purpose | |||||
| Consumer Meters | 19,79,30,130 | 3,76,56,989 | 19.03% | Retail billing, automated prepaid balance disconnection, consumer mobile app telemetry | |||||
| Distribution Transformer (DT) Meters | 52,52,692 | 12,56,448 | 23.92% | Local area energy accounting, technical loss calculation, transformer overload prevention | |||||
| Feeder Meters | 2,05,475 | 1,58,479 | 77.13% | Substation energy dispatch measurement, primary feeder accounting | |||||
| Total RDSS Infrastructure | 20,33,88,297 | 3,90,71,916 | 19.21% | End-to-end grid telemetry from substation to consumer connection |
Feeder metering has progressed four times faster than consumer metering (77.13% vs. 19.03%). Substations are owned, secured, and staffed by the Discom. Installing a feeder meter does not require home visits, property access, consumer consent, or physical rewiring of private meter boxes. In contrast, consumer rollouts encounter locked gates, obsolete wiring boards, faulty service cables, and tenant disputes.
State-wise Deployment Breakdown: Volumes and Completion Rates
National totals conceal severe geographic divergence. While a handful of states have converted millions of consumers to prepaid telemetry, others have not installed a single consumer meter under RDSS.
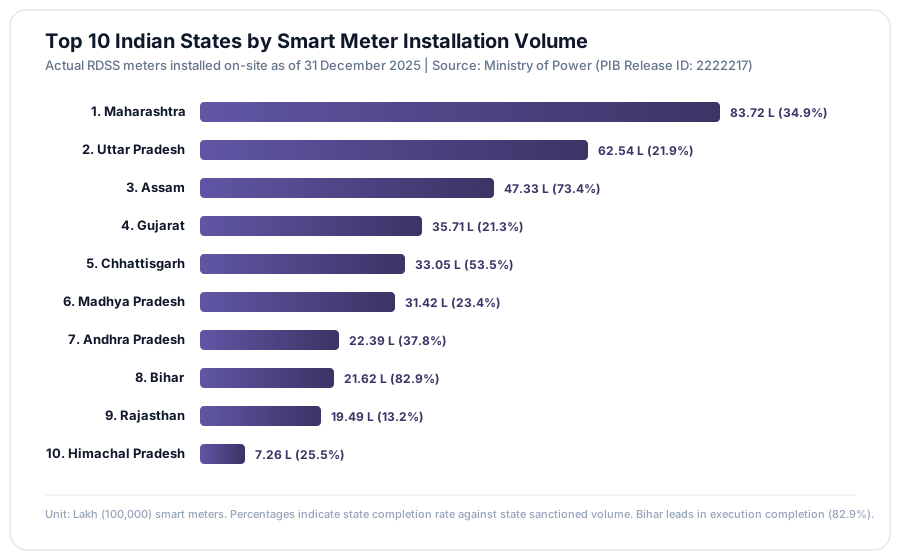
Table 3: Complete State/UT-wise RDSS Sanctioned and Installed Numbers (December 31, 2025)
Source: Ministry of Power, Government of India, Table annexed to Rajya Sabha reply (PIB Release ID: 2222217).
| Sl. | State / Union Territory | Consumer Sanctioned | Consumer Installed | DT Sanctioned | DT Installed | Feeder Sanctioned | Feeder Installed | Total Sanctioned | Total Installed | Overall % | |||||||||||
| 1 | Andaman & Nicobar | 83,573 | 0 | 1,148 | 0 | 114 | 0 | 84,835 | 0 | 0.00% | |||||||||||
| 2 | Andhra Pradesh | 56,08,846 | 21,56,269 | 2,93,140 | 74,389 | 17,358 | 8,192 | 59,19,344 | 22,38,850 | 37.82% | |||||||||||
| 3 | Arunachal Pradesh | 2,87,446 | 47,941 | 10,116 | 311 | 688 | 263 | 2,98,250 | 48,515 | 16.27% | |||||||||||
| 4 | Assam | 63,64,798 | 46,72,329 | 77,547 | 57,731 | 2,782 | 2,879 | 64,45,127 | 47,32,939 | 73.43% | |||||||||||
| 5 | Bihar | 23,50,000 | 19,74,061 | 2,50,726 | 1,82,145 | 6,427 | 5,775 | 26,07,153 | 21,61,981 | 82.92% | |||||||||||
| 6 | Chhattisgarh | 59,62,115 | 32,32,660 | 2,10,644 | 66,023 | 6,720 | 5,936 | 61,79,479 | 33,04,619 | 53.48% | |||||||||||
| 7 | Delhi | 0 | 0 | 766 | 0 | 2,755 | 0 | 3,521 | 0 | 0.00% | |||||||||||
| 8 | Goa | 7,41,160 | 0 | 8,369 | 0 | 827 | 0 | 7,50,356 | 0 | 0.00% | |||||||||||
| 9 | Gujarat | 1,64,87,100 | 34,42,740 | 3,00,487 | 1,28,600 | 0 | 0 | 1,67,87,587 | 35,71,340 | 21.27% | |||||||||||
| 11 | Himachal Pradesh | 28,00,945 | 7,02,046 | 39,012 | 22,054 | 1,951 | 1,603 | 28,41,908 | 7,25,703 | 25.54% | |||||||||||
| 12 | Jammu & Kashmir | 14,07,045 | 4,73,331 | 88,037 | 15,480 | 2,608 | 1,428 | 14,97,690 | 4,90,239 | 32.73% | |||||||||||
| 13 | Jharkhand | 13,41,306 | 5,55,985 | 19,512 | 782 | 1,226 | 829 | 13,62,044 | 5,57,596 | 40.94% | |||||||||||
| 14 | Kerala | 1,32,89,361 | 1,67,077 | 87,615 | 111 | 6,025 | 2,904 | 1,33,83,001 | 1,70,092 | 1.27% | |||||||||||
| 15 | Madhya Pradesh | 1,29,80,102 | 29,90,830 | 4,19,396 | 1,27,231 | 29,708 | 24,097 | 1,34,29,206 | 31,42,158 | 23.40% | |||||||||||
| 16 | Maharashtra | 2,35,64,747 | 80,88,791 | 4,10,905 | 2,52,106 | 29,214 | 30,709 | 2,40,04,866 | 83,71,606 | 34.87% | |||||||||||
| 17 | Manipur | 1,54,400 | 31,962 | 11,451 | 589 | 357 | 220 | 1,66,208 | 32,771 | 19.72% | |||||||||||
| 18 | Meghalaya | 4,60,000 | 0 | 11,419 | 0 | 1,324 | 0 | 4,72,743 | 0 | 0.00% | |||||||||||
| 19 | Mizoram | 2,89,383 | 25,836 | 2,300 | 393 | 398 | 295 | 2,92,081 | 26,524 | 9.08% | |||||||||||
| 20 | Nagaland | 3,17,210 | 30,522 | 6,276 | 845 | 392 | 105 | 3,23,878 | 31,472 | 9.72% | |||||||||||
| 21 | Puducherry | 4,03,767 | 5,647 | 3,105 | 1 | 180 | 0 | 4,07,052 | 5,648 | 1.39% | |||||||||||
| 22 | Punjab | 87,84,807 | 0 | 1,84,044 | 0 | 12,563 | 0 | 89,81,414 | 0 | 0.00% | |||||||||||
| 23 | Rajasthan | 1,42,74,956 | 18,99,467 | 4,34,608 | 23,834 | 27,128 | 25,349 | 1,47,36,692 | 19,48,650 | 13.22% | |||||||||||
| 24 | Sikkim | 1,44,680 | 78,582 | 3,229 | 1,469 | 633 | 471 | 1,48,542 | 80,522 | 54.21% | |||||||||||
| 25 | Tamil Nadu | 3,00,00,000 | 0 | 4,72,500 | 0 | 18,274 | 9,746 | 3,04,90,774 | 9,746 | 0.03% | |||||||||||
| 26 | Tripura | 5,47,489 | 1,40,240 | 14,908 | 5,494 | 473 | 473 | 5,62,870 | 1,46,207 | 25.98% | |||||||||||
| 27 | Uttar Pradesh | 2,69,79,055 | 59,83,729 | 15,26,801 | 2,44,830 | 20,874 | 25,362 | 2,85,26,730 | 62,53,921 | 21.92% | |||||||||||
| 28 | Uttarakhand | 15,87,870 | 4,11,358 | 59,212 | 7,441 | 2,602 | 2,486 | 16,49,684 | 4,21,285 | 25.54% | |||||||||||
| 29 | West Bengal | 2,07,17,969 | 5,45,586 | 3,05,419 | 44,589 | 11,874 | 9,357 | 2,10,35,262 | 5,99,532 | 2.85% | |||||||||||
| Total | RDSS National | 19,79,30,130 | 3,76,56,989 | 52,52,692 | 12,56,448 | 2,05,475 | 1,58,479 | 20,33,88,297 | 3,90,71,916 | 19.21% |
(Note: State numbering in official parliamentary records follows the original gazetted schedule, which skips Index 10. The table encompasses all 28 participating administrative entities).
Dissecting State Variation: Pioneers vs. Non-Starters
Three distinct operational tiers emerge from the data:
- The Scaled Execution States: Maharashtra (83.72 L), Uttar Pradesh (62.54 L), Assam (47.33 L), Gujarat (35.71 L), and Chhattisgarh (33.05 L) account for 2.62 crore installed meters. Together, these five states represent 67.14% of India's total RDSS deployment. Assam's performance (73.43% completion) stands out given the difficult logistics across riverine and hilly terrain.
- The Turnaround Case (Bihar): Bihar pioneered consumer prepaid smart metering before RDSS through state-backed pilot programs. Under RDSS Part-A, Bihar installed 21.62 lakh meters out of 26.07 lakh sanctioned (82.92%), making it the fastest-converting large state in India. The state utility implemented strict disconnections for zero-balance accounts, creating high collection discipline.
- The Non-Starters: Punjab, Goa, Meghalaya, and the Andaman & Nicobar Islands had zero on-site installations as of year-end 2025. In Punjab, political opposition from agricultural unions against prepaid metering stalled Discom field tenders. In Tamil Nadu, while 3.05 crore meters were sanctioned (the largest single-state allocation in India), only 9,746 feeder meters were installed, with zero consumer or DT meters deployed.
Discom Financial Health: AT&C Loss Improvement
The economic rationale for allocating public funds to RDSS is reducing Aggregate Technical and Commercial (AT&C) losses. Discom losses stem from two distinct sources: technical dissipation (unoptimized wires, overloading, long low-tension lines) and commercial theft (unmetered connections, billing tampering, low collection efficiency).
Prepaid smart meters attack commercial losses directly: power ceases when account balance reaches zero, eliminating manual billing friction and unpaid arrears.
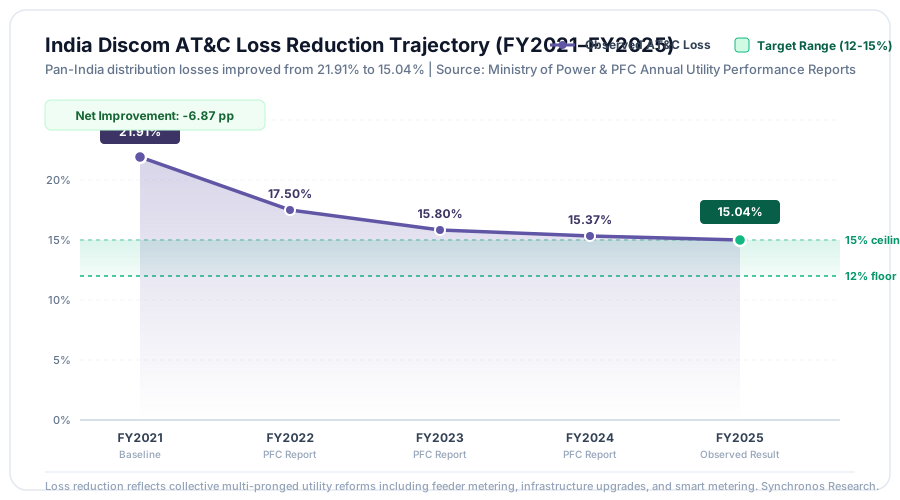
Table 4: National AT&C Loss Reduction Trajectory (FY2021 to FY2025)
| Financial Year | National AT&C Loss (%) | Annual Change (% pts) | Cumulative Change from FY21 | Status & Reporting Document | |||||
| FY 2020-21 | 21.91% | Baseline | Baseline | PFC Utility Performance Report (RDSS launch baseline) | |||||
| FY 2021-22 | 17.50% | -4.41% | -4.41% | PFC Report on Performance of Power Utilities | |||||
| FY 2022-23 | 15.80% | -1.70% | -6.11% | PFC Report on Performance of Power Utilities | |||||
| FY 2023-24 | 15.37% | -0.43% | -6.54% | Ministry of Power Provisional Statistics | |||||
| FY 2024-25 | 15.04% | -0.33% | -6.87% | Ministry of Power (PIB Release ID: 2293896) | |||||
| Target Range | 12.00% to 15.00% | Target | -6.91% to -9.91% | RDSS Policy Mandate ceiling (March 2028) |
Between FY 2021 and FY 2025, national distribution losses fell from 21.91% to 15.04%. This 6.87 percentage point reduction brought the national average to the doorstep of the government's 15.00% target ceiling.
While the Ministry of Power attributes this improvement to smart metering, billing modernization, and feeder separation, smart meters are not the sole contributor. The financial restructuring of Discom legacy debts under state liquidity schemes, infrastructure investments, and industrial tariff rationalization also played substantial roles. A smart meter records energy flow and automates disconnections, but it does not fix a deteriorated low-tension conductor.
Consumer Behavior: Mobile App Adoption and Feature Awareness
Prepaid smart meters require active consumer participation. Consumers must track their account balance, interpret kilowatt-hour readings, and recharge accounts online to prevent service disconnection.
To measure adoption, the scheme's nodal agencies (REC Limited and PFC Limited) conducted a field survey across 1,24,590 consumers who had installed utility mobile applications.
Table 5: REC / PFC Consumer Mobile Application Survey Outcomes
| Survey Indicator | Survey Sample Count | Proportion of App Adopters | Operational Implication for Utilities | ||||
| Total Surveyed App Downloaders | 1,24,590 | 100.00% | Registered consumers with active mobile utility app access | ||||
| Aware of Real-Time Usage Monitoring | 54,321 | 43.60% | Less than half are aware of active daily load profiles or hourly consumption | ||||
| Aware of Recharge & Bill Payment Tools | 72,494 | 58.19% | Primary consumer awareness centers on payment and recharge convenience | ||||
| Unaware of Real-Time Monitoring | 70,269 | 56.40% | Opportunity gap in consumer education regarding energy budgeting features |
The survey indicates that 56.40% of consumers who downloaded the utility app are not aware of its real-time consumption monitoring features. Most consumers recognize the application as a digital recharge tool, similar to a mobile phone wallet, rather than an energy budgeting dashboard.
To improve engagement, utilities have initiated vernacular outreach programs, loudspeaker campaigns in residential clusters, and SMS threshold alerts when prepaid balances fall below critical levels.
Technical Architecture: Standards, Protocols, and Cybersecurity
Under the RDSS Standard Bidding Document (SBD), smart metering projects are executed under a TOTEX (Total Expenditure) framework. Advanced Metering Infrastructure Service Providers (AMISPs) finance, install, and operate the infrastructure for up to ten years, receiving monthly service fees from Discoms tied to operational uptime and service-level agreements (SLAs).
Communication Protocol Architecture
- Last-Mile Telemetry: Cellular NB-IoT (Narrowband IoT), 4G/LTE, and RF Mesh (Radio Frequency Mesh operating in sub-GHz unlicensed bands).
- Interoperability Standard: Compliance with IS 16444 (Indian Standard for A.C. Static Direct Connected Watt-hour Smart Meters) and IS 15959 (Companion standard for Data Identification and Exchange - DLMS/COSEM protocol).
- Head-End System (HES) and Meter Data Management (MDM): Cloud-hosted systems handling data validation, automated estimation, and billing integration.
Cybersecurity and Regulatory Compliance
Smart meters create millions of networked internet-of-things endpoints connected directly to the national power grid. The Ministry of Power established the CSIRT-Power (Computer Security Incident Response Team in Power Sector) to monitor threat vectors.
Key regulatory safeguards include:
- End-to-End Encryption: AES-128 and AES-256 standards for meter-to-HES data packet transit.
- DPDP Act Compliance: Data handling must comply with India's Digital Personal Data Protection Act, prohibiting unauthorized sharing of consumer load profiles with third-party advertising or commercial entities.
- Physical Tamper Alarms: Optical sensors flagging cover openings, magnetic tampering, neutral disturbance, and reverse current flow, triggering automated alerts to Discom vigilance teams.
Grid Telemetry vs. Facility Automation: An Engineering Distinction
A persistent point of confusion among real estate developers and homeowners is equating a government-mandated smart electricity meter with smart home automation.
An electricity meter installed by a distribution company serves the grid operator, not the resident. It is a one-way telemetry and revenue protection tool. It does not measure which room consumes power, does not communicate with air conditioning systems, and does not optimize internal architectural loads.
| Technical Parameter | Utility Smart Meter (RDSS AMI) | Private Facility & Home Automation | |||
| Primary Beneficiary | Power Distribution Company (Discom) | Property Owner / Facility Manager | |||
| Deployment Location | Utility boundary / Building service entrance | Interior distribution board, rooms, and circuits | |||
| Primary Function | Revenue metering, billing, remote disconnection | Real-time circuit control, scene automation, load shaving | |||
| Communication Protocols | DLMS/COSEM, NB-IoT, Cellular 4G, RF Mesh | KNX, DALI-2, Zigbee 3.0, BACnet/IP, Modbus | |||
| Data Resolution | 15-minute or daily billing block averages | Millisecond-level sensor and control response | |||
| Energy Impact Mechanism | Informs consumer of overall cost; forces budgeting | Actively trims lighting, dims ballasts, resets HVAC setpoints | |||
| Sub-Meter Visibility | Zero visibility past the main service breaker | Complete sub-metering by HVAC, lighting, and power circuits |
For developers and villa owners seeking actual operational energy reductions, smart meters provide the baseline tariff signal. Capturing savings requires interior control infrastructure: automated climate setbacks, occupancy sensing, and intelligent lighting scenes. Learn more in our technical analysis of commercial building automation and residential smart lighting.
Research Methodology and Source Documentation
This research report was compiled through systematic extraction of official publications released by the Government of India and associated nodal bodies.
Data Verification Protocol
- Source Hierarchy: Primary government documents take absolute precedence. Data points were sourced directly from the Press Information Bureau (PIB), written parliamentary answers tabled in the Rajya Sabha and Lok Sabha, Central Electricity Authority operational reports, and Power Finance Corporation annual utility performance compendiums.
- Reconciliation: Sanctioned, installed, and loss figures were cross-verified across multiple filings. State-wise totals were verified by summing row-level metrics to ensure exact alignment with published total headers.
- Temporal Normalization: Where figures from different reporting periods are cited (e.g., December 2025 vs. August 2026), the exact reporting date and document reference are explicitly identified.
Primary Source Directory
- Source 1: Ministry of Power, Government of India. Progress on Smart Meter Installation under RDSS. PIB Delhi, Release ID: 2222217. Published February 2, 2026. Official PIB Record
- Source 2: Ministry of Power, Government of India. Modernisation of the Power Sector and Reliable Electricity Supply. PIB Delhi, Release ID: 2293896. Published August 3, 2026. Official PIB Record
- Source 3: Ministry of Power, Government of India. Revamped Distribution Sector Scheme. Rajya Sabha Unstarred Question No. 156. Answered July 21, 2025. Ministry of Power Official Filing
- Source 4: Power Finance Corporation (PFC) Limited. Report on Performance of Power Distribution Utilities (Annual Reports, FY21 to FY24). New Delhi: Ministry of Power. PFC India Portal
- Source 5: Ministry of Power, Government of India. Revamped Distribution Sector Scheme (RDSS) Operational Guidelines and Standard Bidding Document. Ministry of Power Guidelines
Machine-Readable Data Downloads
To facilitate editorial analysis, academic research, and policy review, the full 93-point statistical ledger for this study is available for download:
- Download Complete Dataset (CSV):
/data/india-smart-meter-statistics-2026.csv(comma-delimited tabular format including metric IDs, values, units, denominators, geography, periods, and URLs). - Download Complete Dataset (JSON):
/data/india-smart-meter-statistics-2026.json(structured JSON array with complete metadata).
Technical Consultation
Synchronos Solutions advises developers, architectural firms, and corporate enterprise clients on sub-metering infrastructure, energy audits, and facility automation across South India. If your project requires revenue-grade sub-metering design, KNX/BACnet integration, or electrical infrastructure planning, contact our engineering team:
- Commercial & Enterprise Inquiries: Review our commercial building automation solutions or schedule an automation design consultation.
- Residential Integrations: Explore our luxury villa home automation portfolio or speak directly with an engineer at [email protected].